SPP Interconnection Queue Map
Fourteen states of interconnection queue on a map, re-synced every fifteen minutes — with the study-cycle history that shows which projects are really progressing.
Explore the Map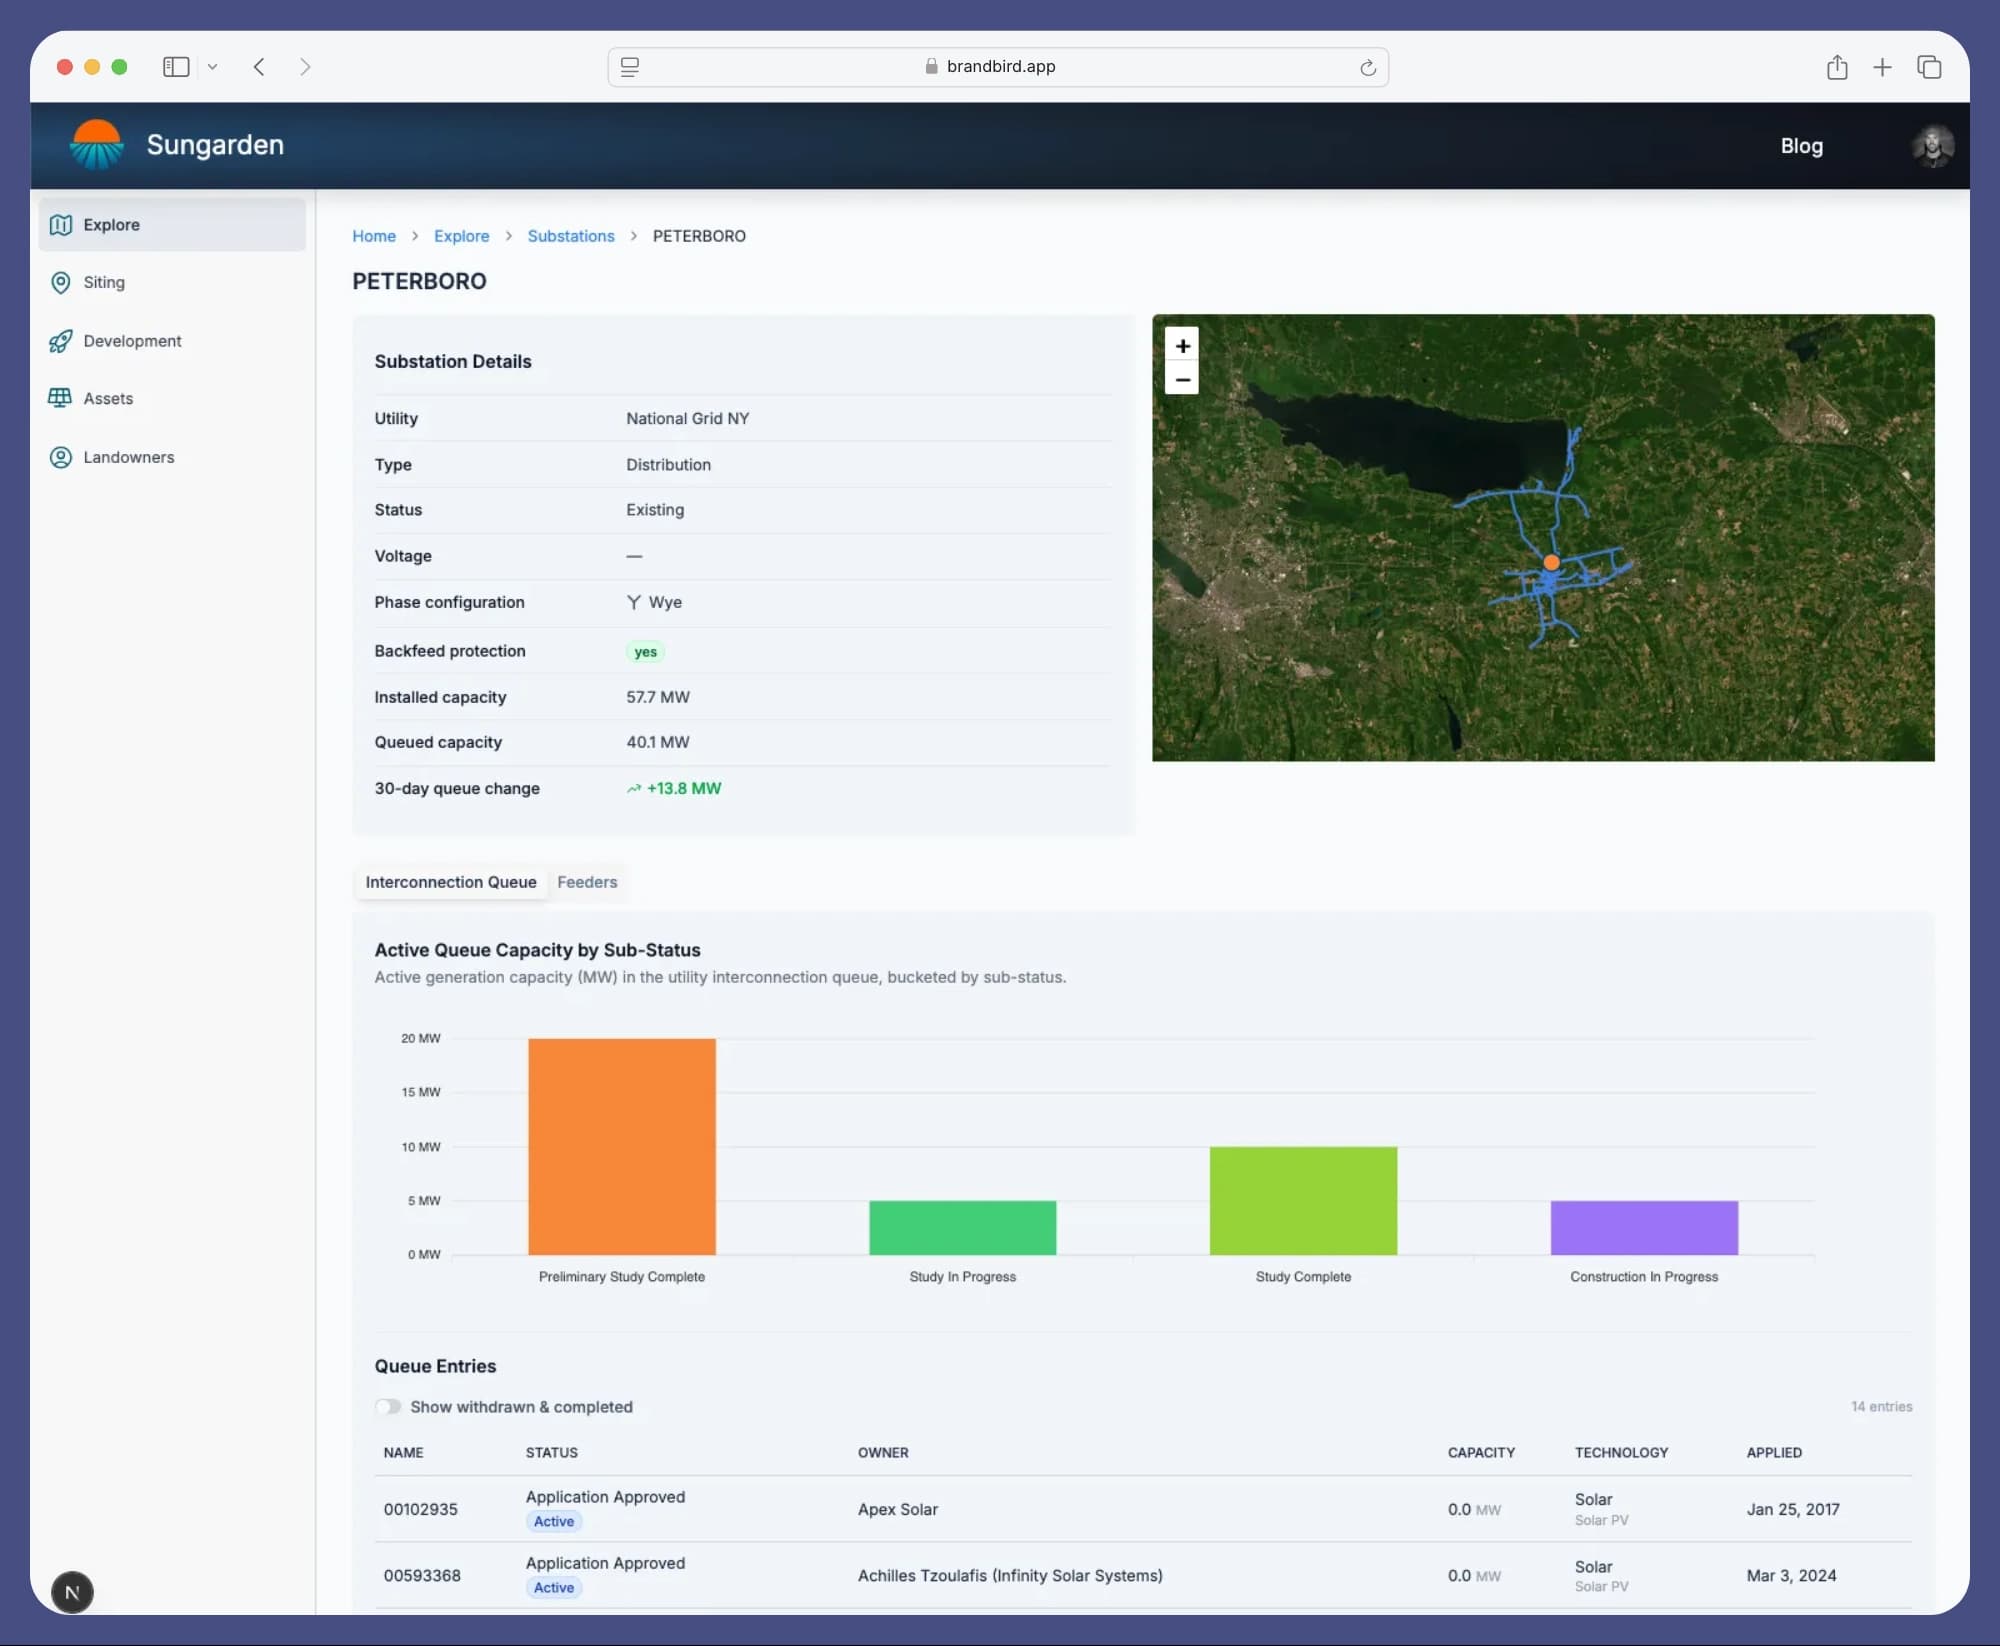
Long study cycles, heavy attrition
The Southwest Power Pool runs from the Dakotas south through Kansas and Oklahoma into the Texas panhandle. It built its generation fleet around wind, and is now absorbing substantial solar and storage interest on top of a transmission system planned for a different resource mix.
The result is a queue characterised by long study cycles and high attrition. Projects enter, sit through successive study phases, and a large proportion leave before reaching an interconnection agreement — often because the upgrade costs assigned to them in a study phase make the project uneconomic.
Attrition is information, if somebody records it
In a market where most queued projects will not be built, knowing which ones are leaving is more useful than knowing how many are nominally present. A withdrawal in your study cluster can change the upgrades allocated to you, and a series of date extensions is usually the visible symptom of a project in trouble.
We re-pull the SPP queue every fifteen minutes and keep every snapshot, retaining the previous value whenever a status or date changes. That gives you the attrition record rather than a single frame of it, and alerts when a project near you withdraws.
What Sungarden loads for SPP
- Queue entries, re-synced every 15 minutes
- Schedule-slip tracking — we keep the previous and new withdrawal, completion and commercial-operation dates
- Alerts when a project's status changes or it withdraws
- Daily queued-capacity history by status and fuel type
- Not loaded yet: Points of interconnection as mapped geometry
- Not loaded yet: Load and pricing zone boundaries
- Not loaded yet: Substations
- Not loaded yet: Parcel boundaries and ownership within the footprint
- Not loaded yet: Utility feeder hosting capacity within the footprint
Queue entries are the ISO's own records, republished rather than recalculated. Capacity figures are what the developer reported at filing, and queued megawatts are not deliverable megawatts — several markets allocate deliverability separately from queue position.
Frequently asked questions
What is a DISIS study cycle?
SPP groups interconnection requests into Definitive Interconnection System Impact Study cycles, evaluating them together and allocating identified network upgrades among the participants. Cycles have historically taken a long time to clear. As in every US market the procedures are being revised under FERC Order 2023 compliance, so confirm current cycle structure and timing with SPP.
Why is the withdrawal rate so high in SPP?
The most common pattern is a project receiving its assigned network upgrade costs in a study phase and concluding the economics no longer work. Because upgrades are allocated across a study cluster, those costs can also shift as other projects leave, which is why attrition tends to cascade within a cycle.
What does the queue tell me if most of it will not be built?
It tells you where developer attention is concentrated, and — read over time rather than as a snapshot — which of those projects are actually progressing. A project that has extended its in-service date three times is telling you something a single queue download will not.
Do you carry parcel data in SPP territory?
No. Parcel boundaries and ownership are limited to New York and Minnesota, and Minnesota sits in MISO rather than SPP. In SPP you get the queue, the status and date history, and the alerts, without a land layer beneath them.
How current is the queue data?
We re-pull the SPP queue every fifteen minutes and keep every snapshot, so you get each project's status and date history rather than only its present state, with alerts when a project withdraws or moves its dates.
Other interconnection queues
Or start from the interconnection queue overview to compare every market we track.
Track the attrition, not just the queue total.
Get Started For FreeSungarden is an independent platform and is not affiliated with or endorsed by SPP (Southwest Power Pool).
Queue data is republished from SPP'sown public interconnection queue postings. We do not independently verify it, and where our records differ from the ISO's published queue the ISO's data governs. Queue entries reflect what a developer reported at the time of filing: capacity figures, in-service dates, and points of interconnection all change, and a project appearing in the queue is not evidence that it will be built.
Queued capacity is not deliverable capacity. Several markets allocate deliverability separately from queue position, so a project can hold a queue position without being able to deliver energy, and aggregate queued megawatts should not be read as committed supply.
Descriptions of interconnection processes on this page are general summaries. Interconnection rules are being revised across every market under FERC Order 2023 and its compliance filings, so procedures, timelines and study structures change. Nothing here is legal or engineering advice or a substitute for the ISO's current tariff and business practice manuals — confirm applicable requirements with the ISO.