PJM Interconnection Queue Map
The largest interconnection queue in the country, on a map — with transmission zone boundaries, substations, and alerts when the queue ahead of you moves.
Explore the Map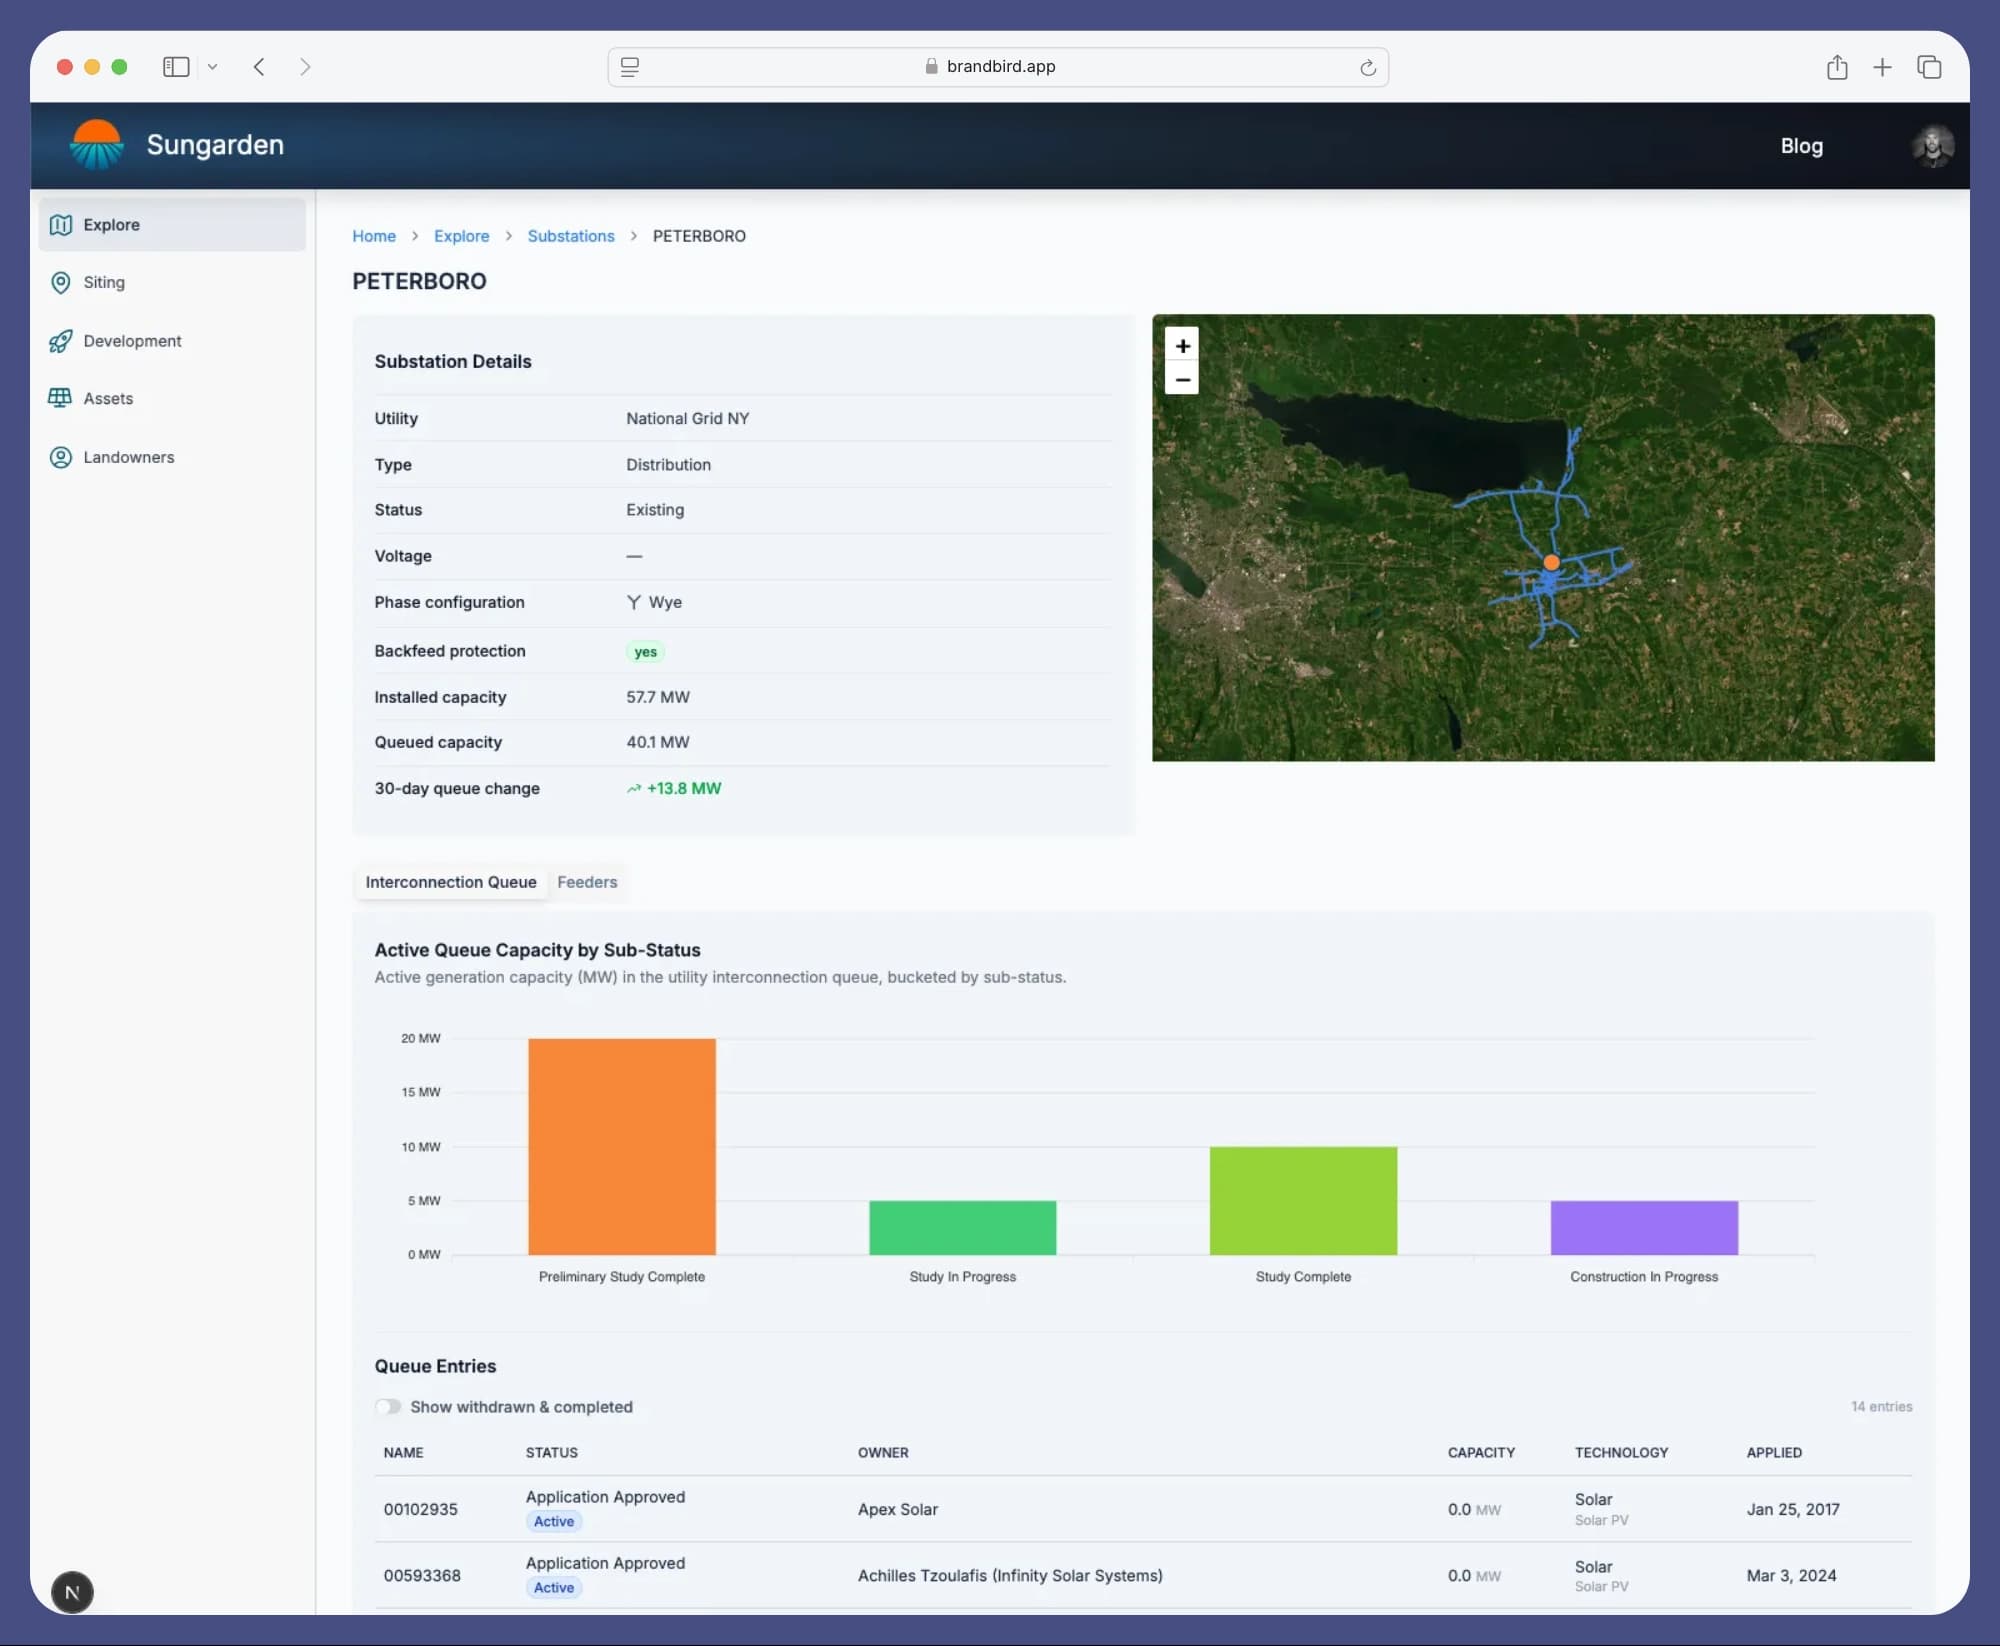
The queue that got so long it had to be rebuilt
PJM covers all or part of thirteen states and the District of Columbia, from Illinois east to New Jersey and south into Virginia and North Carolina. It also accumulated the largest interconnection backlog in the United States — large enough that the old first-come, first-studied approach stopped functioning and the process was restructured into cycle-based cluster studies.
For a developer that restructuring changed the fundamental question. Under a serial process you cared about your own position. Under a cluster process you care about your cycle: the upgrades the group triggers are allocated across its members, so your cost depends on who else is in it and whether they stay.
Zones, substations, and the events that move your allocation
PJM is one of the two markets where we carry transmission zone boundaries and substations alongside the queue, which matters because cost allocation in this market is regional. Seeing which zone a site sits in, and which substation the queued capacity around it is attached to, is the difference between a queue table and a screening tool.
We re-pull the queue every fifteen minutes and retain every snapshot. When a project changes status or moves its dates, the previous value is kept beside the new one — so a withdrawal inside your cycle is something you can be alerted to rather than something you reconstruct afterwards.
What Sungarden loads for PJM
- Queue entries, re-synced every 15 minutes
- Schedule-slip tracking — we keep the previous and new withdrawal, completion and commercial-operation dates
- Alerts when a project's status changes or it withdraws
- Daily queued-capacity history by status and fuel type
- Load and pricing zone boundaries
- Substations
- Not loaded yet: Points of interconnection as mapped geometry
- Not loaded yet: Parcel boundaries and ownership within the footprint
- Not loaded yet: Utility feeder hosting capacity within the footprint
Queue entries are the ISO's own records, republished rather than recalculated. Capacity figures are what the developer reported at filing, and queued megawatts are not deliverable megawatts — several markets allocate deliverability separately from queue position.
Frequently asked questions
How does PJM's cluster study process work?
PJM groups interconnection requests into study cycles and evaluates each cycle together rather than one project at a time. Network upgrades identified for the group are allocated among its members, so your cost depends on the composition of your cycle. The process was restructured to address a very large backlog, and like every US market it continues to be revised under FERC Order 2023 compliance, so confirm the current procedure and cycle timing with PJM.
Why does a withdrawal in my cycle matter so much?
Because cluster cost allocation is shared. When a project leaves the cycle, the upgrades attributed to it are reallocated among those remaining, which can move your cost in either direction. It is the single most consequential event that happens to a queued project and it is not visible in a static queue download.
Does Sungarden carry PJM transmission zones?
Yes. PJM transmission zone boundaries and substations are both loaded, alongside the queue entries themselves. That lets you see which zone a prospective site falls in and what capacity is already queued at the substations near it.
Is queued capacity in PJM likely to be built?
A large share of it will not be. Withdrawal rates across US interconnection queues are high, and PJM's backlog in particular contains a great deal of capacity that will never reach commercial operation. Queue totals measure developer intent, not future supply, and queue position does not by itself establish deliverability.
How current is the queue data?
We re-pull the PJM queue every fifteen minutes and keep every snapshot, so you get each project's status and date history rather than only its present state, with alerts when a project withdraws or pushes its dates out.
Other interconnection queues
Or start from the interconnection queue overview to compare every market we track.
See what is queued before you pick a cycle.
Get Started For FreeSungarden is an independent platform and is not affiliated with or endorsed by PJM (PJM Interconnection).
Queue data is republished from PJM'sown public interconnection queue postings. We do not independently verify it, and where our records differ from the ISO's published queue the ISO's data governs. Queue entries reflect what a developer reported at the time of filing: capacity figures, in-service dates, and points of interconnection all change, and a project appearing in the queue is not evidence that it will be built.
Queued capacity is not deliverable capacity. Several markets allocate deliverability separately from queue position, so a project can hold a queue position without being able to deliver energy, and aggregate queued megawatts should not be read as committed supply.
Descriptions of interconnection processes on this page are general summaries. Interconnection rules are being revised across every market under FERC Order 2023 and its compliance filings, so procedures, timelines and study structures change. Nothing here is legal or engineering advice or a substitute for the ISO's current tariff and business practice manuals — confirm applicable requirements with the ISO.