Orange & Rockland Hosting Capacity Map
Feeder hosting capacity across Orange, Rockland, and Sullivan counties — on the same map as parcels, ownership, substations, and New York's SIR interconnection queue.
Explore the Map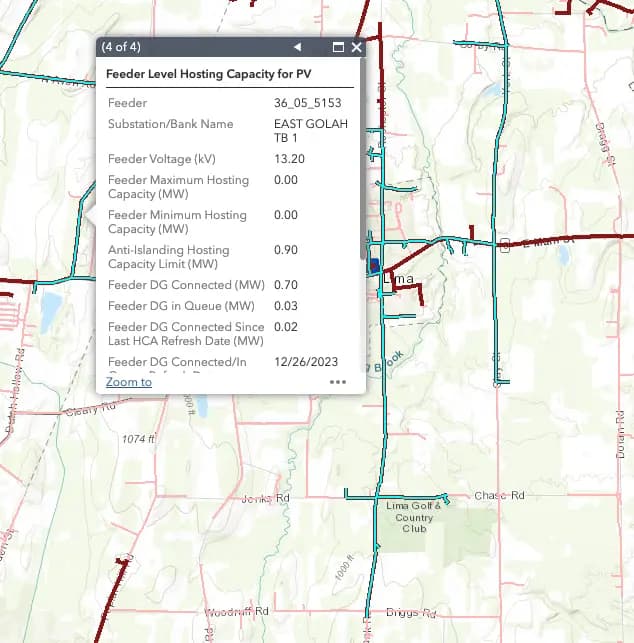
The smallest territory, where the queue decides everything
Orange & Rockland serves roughly 230,000 New York electric customers across Orange, Rockland, and Sullivan counties — the fewest customers of the six Joint Utilities. A compact system means a short list of viable interconnection points, and each new application takes a meaningful bite out of what is left.
The result is that capacity here is unusually volatile. A circuit that looked workable can be fully subscribed by a single project, and a withdrawal can reopen a substation that had been written off. Reading the published capacity number without reading the queue beside it is close to meaningless in this territory.
A small system that sites like an upstate utility
O&R's downstate corporate ownership misleads people into expecting the dense-urban interconnection problems of the metro system. It runs a conventional radial network across suburban and rural counties instead, so the familiar upstate logic applies: find a circuit with headroom, then work outward to the land around it.
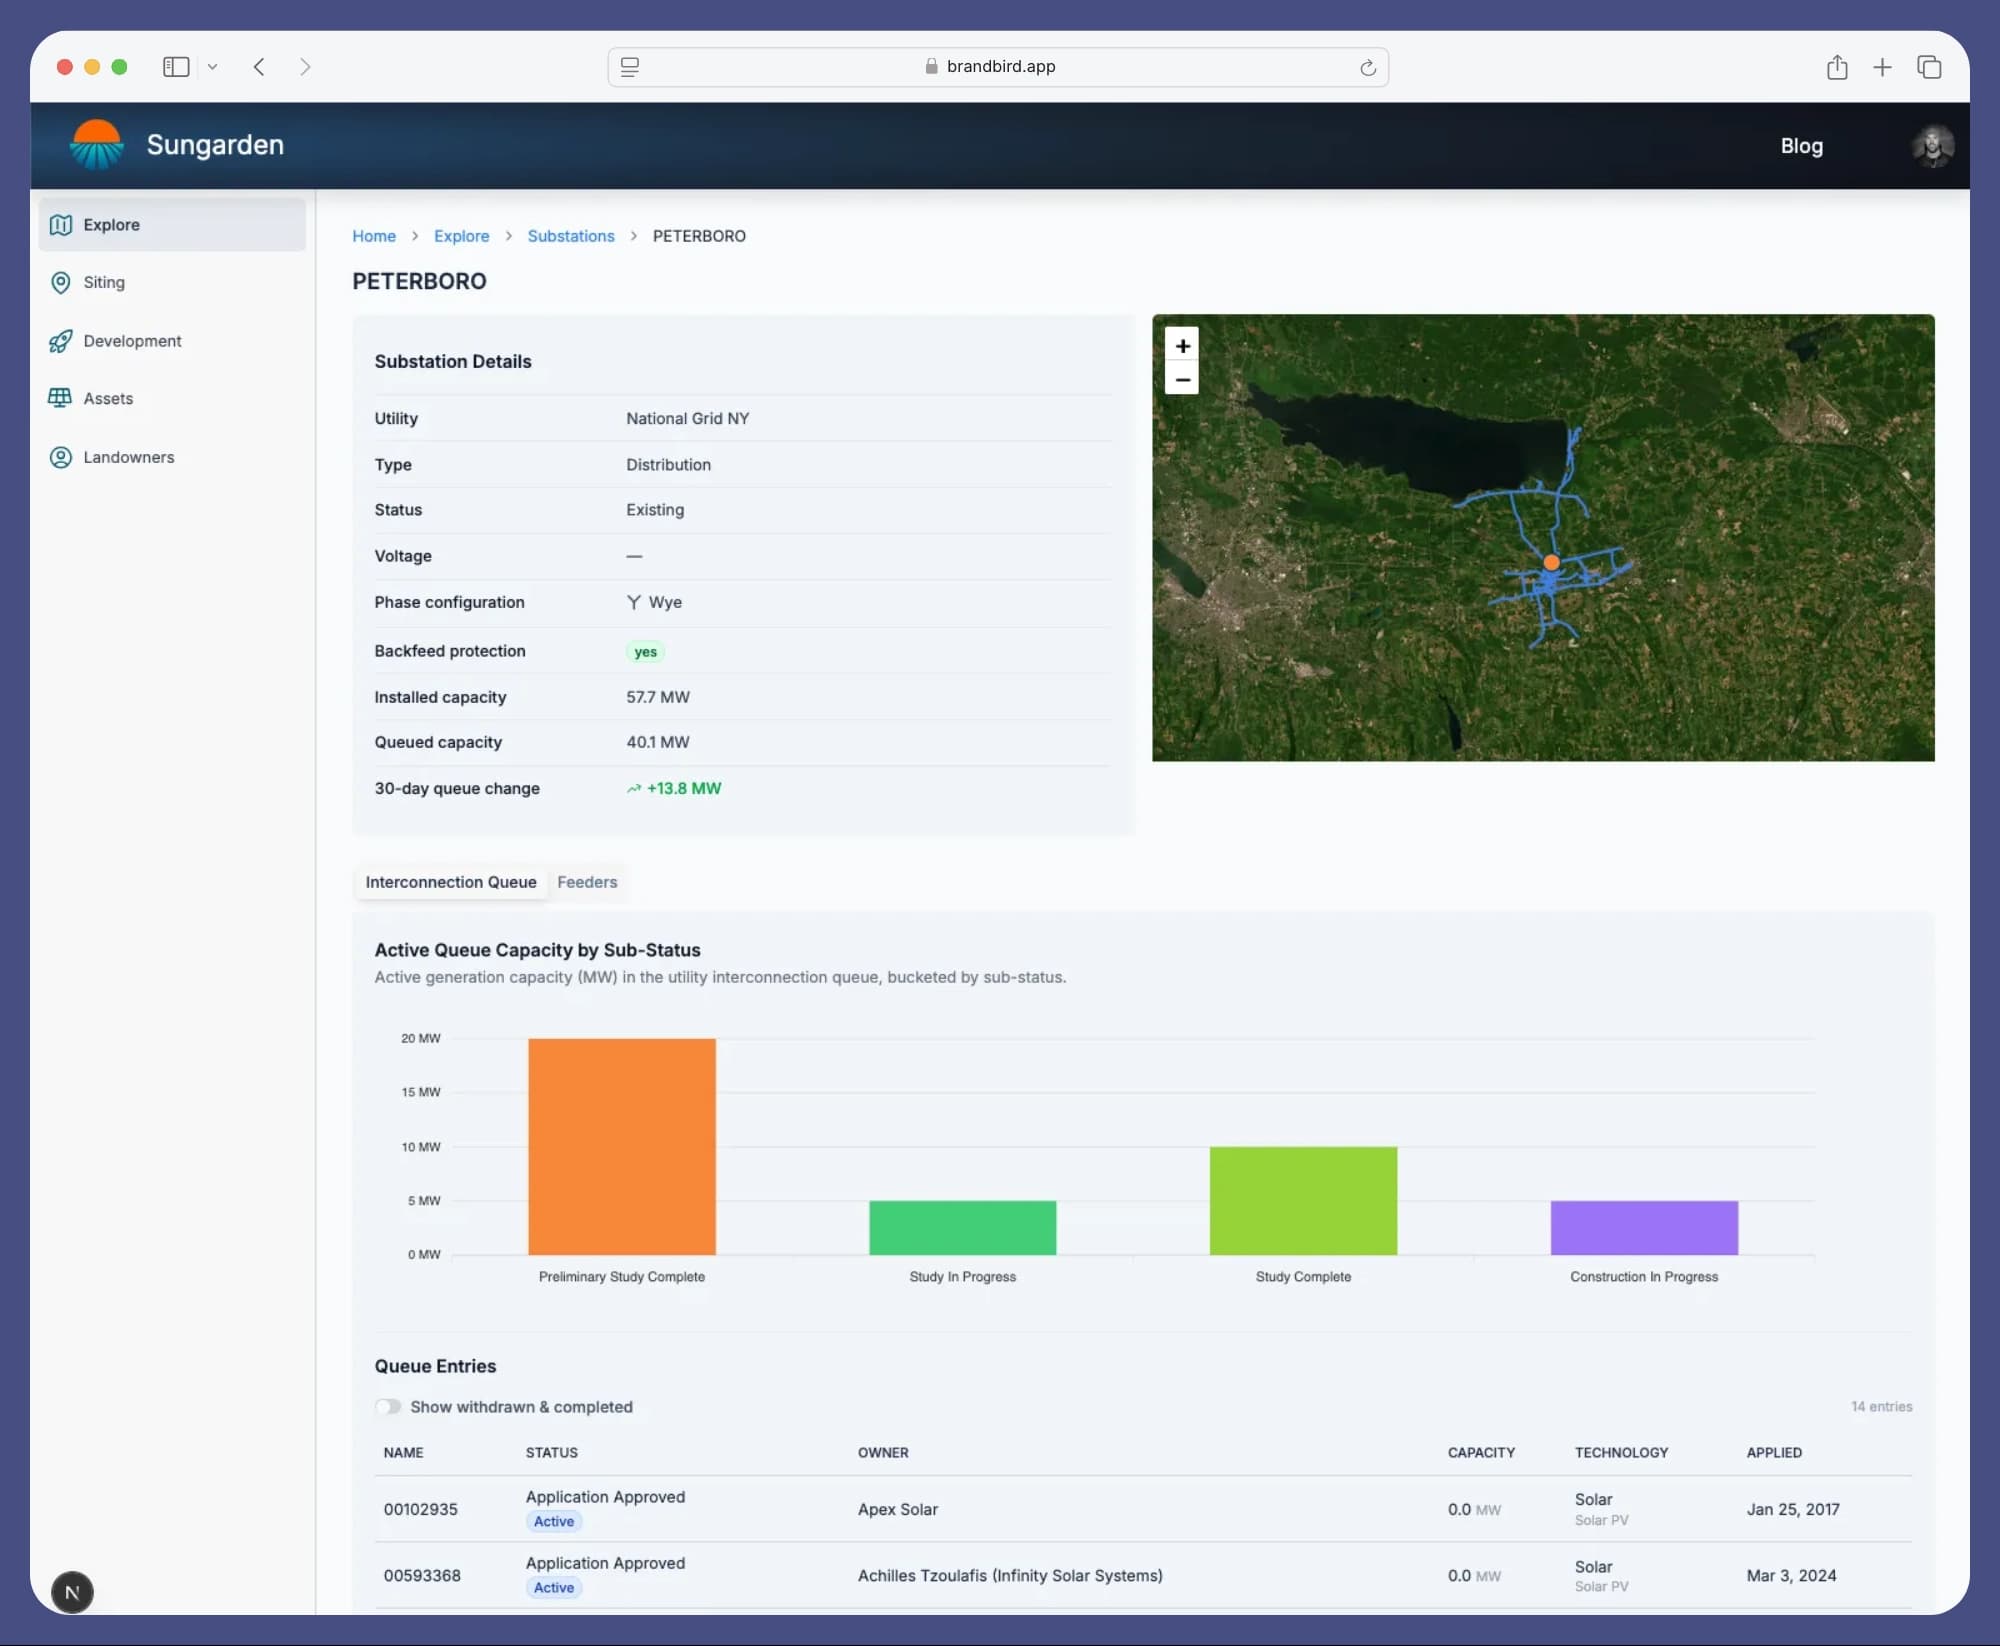
Where that land is depends on the county. Rockland is dense and expensive, Orange is the middle ground, and the part of Sullivan County O&R serves has the acreage — paired with longer circuits and Catskill terrain. Much of Sullivan is NYSEG territory, though, so confirm the utility before you work a parcel. Sungarden keeps O&R's hosting capacity map in sync and layers it with parcels and ownership, slope, wetlands, and New York's SIR queue. Because we retain every snapshot of that queue, you can see when a project was withdrawn and room reopened at a substation, not just where things stand today.
The published number is not what's left
A hosting capacity figure is a screening value, not the room remaining on the circuit. In New York the published figure already accounts for the generation installed when the analysis was run — but that analysis runs annually, while the installed and queued totals are refreshed monthly. So the figure is net of generation as of its own refresh date, not as of today, and it is not net of the queue at all.
That makes the arithmetic easy to get wrong in both directions. Subtracting every installed megawatt double-counts what the analysis already removed and makes a workable circuit look dead. Subtracting nothing overstates the room by however much has interconnected since. The only installed figure you can subtract is the generation connected since that refresh date, which is why the utilities publish it as its own number.
Sungarden carries all of it for Orange & Rocklandas the utility reports it — published minimum and maximum, installed DG, queued DG, and the DG connected since the last analysis refresh — and derives what's left on that basis, recorded per utility rather than assumed. You can filter for circuits with real room rather than paper room.
Feeder primary voltage sits alongside it, which drives interconnection cost more than most screening tools acknowledge — a 27 kV tie is a different budget from a 13.8 kV one before any study begins.
What Sungarden loads for Orange & Rockland
- Feeder-level hosting capacity, as published by the utility, with line geometry
- Substations
- Parcel boundaries, with owner attributes wherever the source county publishes them (New York)
- Interconnection queue entries, mapped to a substation or feeder where the utility's data identifies one
- Not loaded yet: A full feeder dataset — voltage, ratings, and substation links beyond the hosting capacity lines
- Not loaded yet: Feeder load curves
A published hosting capacity value is the utility's own figure — we republish it rather than recalculating it. Because the New York utilities are not uniform about whether that number is already net of installed and queued generation, we normalize per utility before deriving remaining headroom, so the remainder is comparable across territories.
Frequently asked questions
Where does Orange & Rockland publish its hosting capacity map?
O&R publishes feeder-level hosting capacity through its public Hosting Capacity Map, under the Joint Utilities of New York's commitments from the state's Reforming the Energy Vision proceedings. It is a standalone GIS viewer — circuits and capacity values, with no parcels, no ownership, and no queue context.
Does O&R behave like its downstate parent company?
Not electrically. O&R runs a conventional radial distribution system across suburban and rural counties, so siting here follows the familiar upstate logic: find a circuit with headroom, then work outward to the land around it. The corporate ownership misleads people into expecting the dense-urban interconnection problems of the downstate metro system, which do not apply on O&R's network.
Why does queue position matter so much in O&R territory?
Because it is the smallest of the six Joint Utilities territories, serving roughly 230,000 New York electric customers. Fewer substations and fewer circuits mean a small number of viable interconnection points, and each application consumes a larger share of what is available. Capacity can go from comfortable to committed on the strength of one project, so watching the queue is not optional here.
Where in the territory is there actually room to build?
Rockland County is dense and expensive, with little large open land. Orange County offers a middle ground. Sullivan County, running up into the Catskills, has the most available acreage in the part of the county O&R serves — with the tradeoff that circuits are longer, capacity thins with distance from the substation, and slope becomes a genuine screening constraint.
How current is the data in Sungarden?
New York's utilities publish their DG interconnection queues to the NY DPS as spreadsheets that post roughly monthly. Sungarden monitors them continuously, so a change appears as soon as it posts, and we keep prior versions so you can see a project's status history rather than just its current state. Hosting capacity is a slower-moving dataset: each utility republishes on its own cadence and we reload it when they do.
Other New York hosting capacity maps
Or start from the New York hosting capacity overview to compare every utility in the state on one map.
Watch capacity open up in O&R territory.
Get Started For FreeSungarden is an independent platform and is not affiliated with or endorsed by Orange & Rockland.